Can it generate graphs from the readings? Which ones?
The results are expressed in table format and graphical format, those will be integrated into the PDF.
All the information from the Power quality and burden test have graphics that are displayed in real time to enable an live assessment on the instalations.
The graph can also be displayed in full screen mode.
Vector Diagram to see your phase angles (phasors) 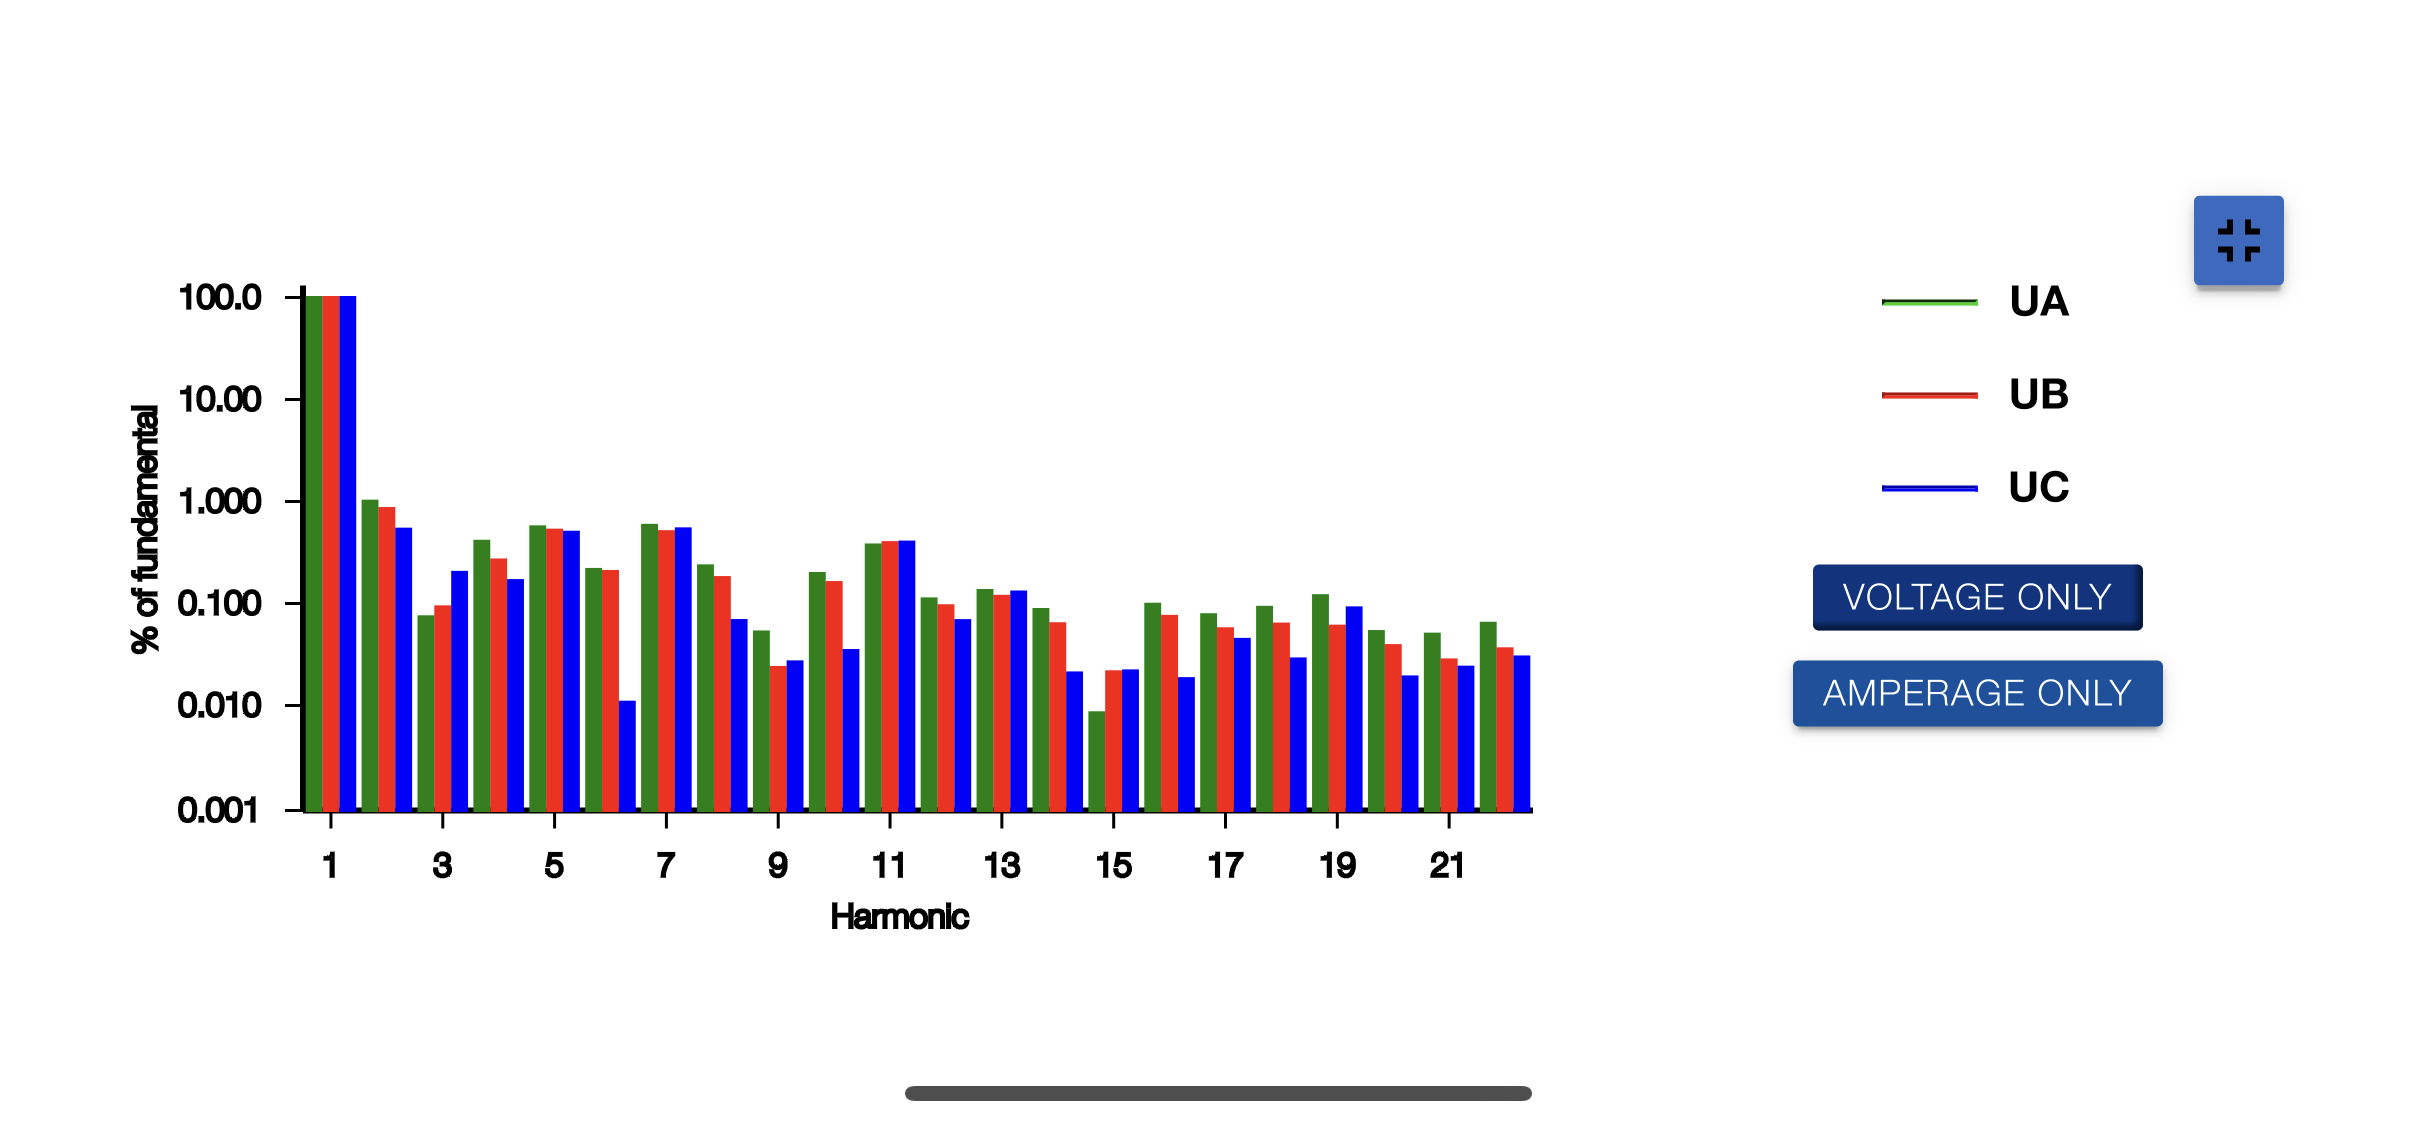 Full Screen Mode
 - Waveform
- THD
- and more.